SEO is a long-term game. Sometimes, it may take a few weeks to months to see results.
But how do you show that your B2B SEO strategy is running on course?
This is where SEO reporting comes into play.
What’s the Point of an SEO Report?
An SEO report is a document used to track the performance of your SEO efforts. It gives you insight into the parts of your marketing strategy working and those floundering.
That’s why the best B2B SEO agencies swear by them.
Because of the complexity of SEO, your SEO report must be easy to understand. For this to be possible, it must have clear categories. Examples of the information to include in your SEO report include:
- An overview that includes the goals of the campaign
- Key metrics being tracked
- High-level opportunities you’ve uncovered
Make sure only to include relevant information. Otherwise, your report could easily become messy and hard to follow. Also, make sure to use language the recipients understand and to use visuals as much as possible. This will help make the SEO report clear and easy to understand.
Why is SEO Reporting Important?
Like any type of reporting, such as monthly financial reporting, or an annual review, an SEO report gives a wealth of information that a brand can use to build more robust marketing strategies. For example, you get to understand:
- The type of content formats your audience loves.
- The topics they resonate the most with.
- Conversion metrics
- Competitor analysis
- Posts that generate the most traffic or revenue
- Keywords you’re ranking for and those you’re still to rank for
- Trends in your industry
All this data will help you better anticipate your customers’ needs. It also gives you the arsenal you need to create explosive marketing campaigns.
How Reports & Dashboards Work Together
To give your team or clients comprehensive information about the SEO campaign you’re running, you’ll need to know how to use reports and dashboards in tandem. These are your primary data collection and presentation tools.
What’s in an SEO Report?
A report is a static document containing relevant SEO data. The data can be presented in various formats such as:
- Text
- Numbers
- Charts
- Tables
- Visuals
Reports are usually generated periodically to give stakeholders a full narrative of SEO performance over a predetermined period. The data is cleaned, sorted, and organized into a consumer-friendly document. Of course, this ultimately means a report doesn’t contain live data.

What’s an SEO Dashboard?
A dashboard is a visualization tool designed to give the user important information on a topic related to business performance. Because of this, it’s usually used to present particular key performance indicators (KPIs). In this case, the KPIs you set for your SEO campaign.
Dashboards are designed to present data in a concise, easy-to-understand way as they’re generally used to help users make a business decision. In addition, because they are configurable, they give you the exact data you want when you need it.
You can create a custom SEO dashboard that pulls data straight from Google Analytics using tools like DashThis, Klipfolio, and even Excel, among others. You can also use a free tool like Google Data Studio to create beautiful dashboards like this one, this one, and this one. The options with Google Data Studio are unlimited.
Wait, Then How Do They Support Each Other?
A few of the significant differences between dashboards and reports are:
- Dashboards present live data while reports contain static data.
- Reports contain detailed information, while dashboards focus more on the bigger picture.
- A dashboard presents data on a single page, while a report could run into many pages.
How to Use Reports & Dashboards in Tandem: AKA, Time to Show Off That Amazing SEO Growth
So how can you use a report and a dashboard to showcase the progress you’re making with your SEO?
As you can see in their differences, reports and dashboards present data in different ways. This is what makes it a great idea to use them together.
How?
You can use a report to get a high-level view of your SEO campaign’s performance. This will help you know:
- Where you stand in terms of the competition
- What you need to do to get ahead
- The parts of your strategy that need more effort
- Opportunities to take advantage of
In essence, a report gives you the insights you need to create a campaign or build better iterations of a live campaign.
On the other hand, because a dashboard gives you live data, it helps you monitor the progress of your campaign in real-time. This enables you to make necessary changes on the fly. Another advantage with dashboards is that they allow you to zero in on a particular aspect of a campaign, allowing you to fine-tune each element individually.
Report vs. dashboard — which should you use for SEO reporting?
The short answer is both.
What KPIs Should You Include in Your SEO Dashboard?
For your SEO campaign to be effective, you must set goals. You must have specific objectives you target to reach. To know how you’re progressing in attaining your goals, you must align each goal with a measurable key performance indicator (KPI). Here are some of the most important KPIs you should include in your dashboard:
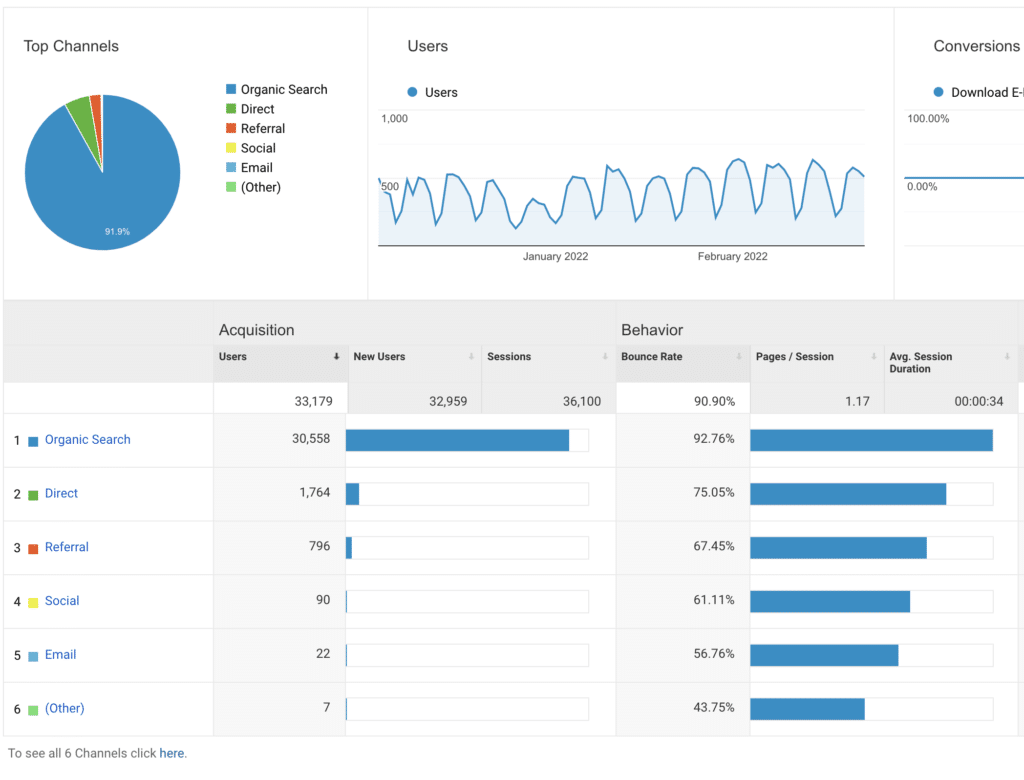
New Users
These are first-time visitors to your site, and the metric is important as it shows the extent of your content’s reach. In addition, it’s an indicator of how visible your content is on SERPs. The higher the number, the better your campaign is performing.
Organic Clicks
This metric shows the number of times your site’s listing was clicked on in organic search results. You can get this from Google Search Console, and it’s a great way to help determine your conversion rate.
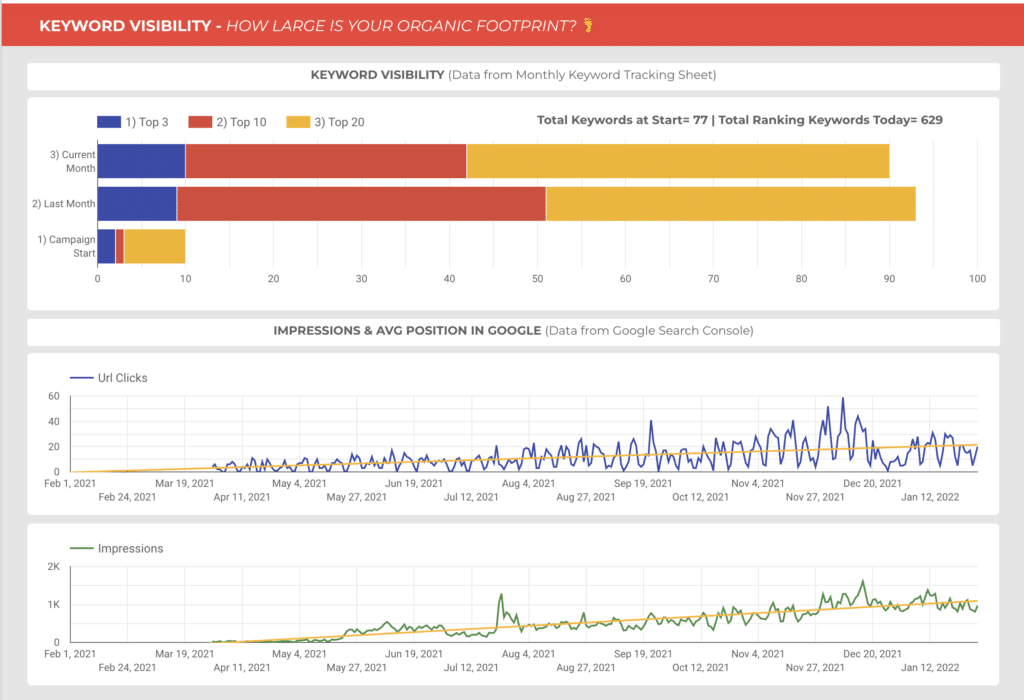
Overall Keyword Visibility
Monitoring keywords is a vital part of any SEO campaign. Not only must you know how well you rank for certain keywords, but you must also gauge the overall keyword visibility. This involves pulling data about traffic potential to that keyword and related keywords you’re ranking for or should be ranking for, among other factors.
Target Keyword Rankings
One of the primary goals of SEO is to rank high on SERPs. That’s why keyword rankings must be one of the top metrics in your dashboard. It will help you see which keywords you rank for and those that require more work for them to rank.
Organic Clickthrough Rate (CTR)
This metric shows the percentage of visitors who click on your link on SERPs over those who see it (impressions). A high CTR results in more traffic and leads to better rankings.
Pages Per Session
The pages per session KPI refers to the average number of pages a user visits on your website. A high number indicates that your visitors find your content relevant — it’s a sign that your content matches user intent.
Average Session Duration
This metric shows the average time a user spends on your website. A session is defined as the time a user spends from the moment they click into your website until they exit your website. You can find this in the Audience Report in Google Analytics.
FYI, the average session duration is not the same as average time on page. The latter refers to the time spent on a single page. Again, a higher average session duration means your efforts are paying off.
Event-based Conversions
Event-based conversions refer to conversion metrics that track a visitor’s specific action on your site. These can be link clicks, adding an item to a cart, form submissions, video views, and other actions relevant to your business. You can set these in Google Analytics under the “Goals” section of the “Conversions” tab. These are essential as they help you get a better outlook on SEO metrics that matter to your business goals.
Customers or Deals Closed
SEO is not just about improving your visibility on SERPs. Ultimately, it must result in inbound leads turning into closed deals and customers. That’s why you must always measure the number of new deals and customers generated by a campaign. After all, this is the ultimate goal of every SEO campaign.
To track new deals and customers, you must have a robust customer relationship management tool (CRM). You can connect your CRM to Google Analytics to help track the entire customer journey from the time a visitor lands on your website to the time they become a paying customer.
Integrating Google Analytics into your CRM and tracking metrics like deals closed may require a lot of effort and resources up front, but the results are definitely worth it.
Domain Rating
Another metric you must diligently watch is your domain rating (DR). This is a metric developed by Moz, and it measures the strength of a website’s backlink profile. This is compared to other websites and is rated on a 100-point scale. The higher your DR, the better the chances of your content ranking. Keep an eye on this metric and continue making efforts to ensure your website continues ranking high on SERPs.
Top Landing Pages
As you build your SEO reporting dashboard, make sure to include your top landing pages as a KPI.
Your top landing pages are those pages or posts most visitors to your website come through. You can easily find your top landing pages in Google Analytics by going to the “Behavior” then clicking on Site Content > Landing Pages. The Landing Pages report will give you granular insight on each page’s sessions, bounce rates, time spent on page, and much more. You also get to see a clear picture of your top landing pages.
Why is this KPI important?
Monitoring your top landing pages helps you, among other things:
- Understand what your visitors need
- Gain insight into what makes for high-conversion pages
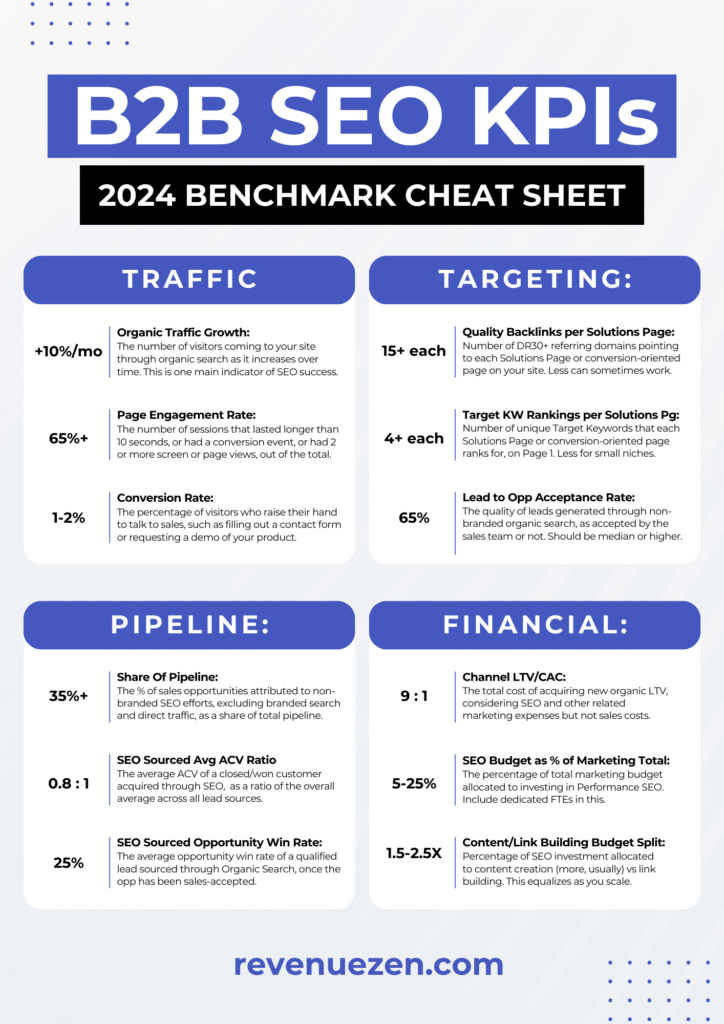
Going beyond the dashboard, consider incorporating more pipeline and financial KPIs down the funnel, to illustrate the impact of your SEO work on overall company sales growth. Here’s a cheat sheet you can download and keep for future reference:
How Exactly Does RevenueZen Handle SEO Reporting?
That’s why you’re here, isn’t it? To discover exactly how we report SEO movement to our clients?
It’s important to understand not all metrics are useful to assess at every stage of an engagement. We break our reporting down depending on where we’re at with a client’s strategy.
For example, if we’re only 2-3 months into an engagement with a client, and are just getting content live, it’s unlikely we’ll see tangible inbound leads. What we’re looking at at this point of the life cycle is most likely impressions or keyword growth.
A few more months in however, and we should expect to see tangible inbound leads.
While each client is nuanced, our monthly SEO reporting call typically covers a few main areas.
Months 2-4
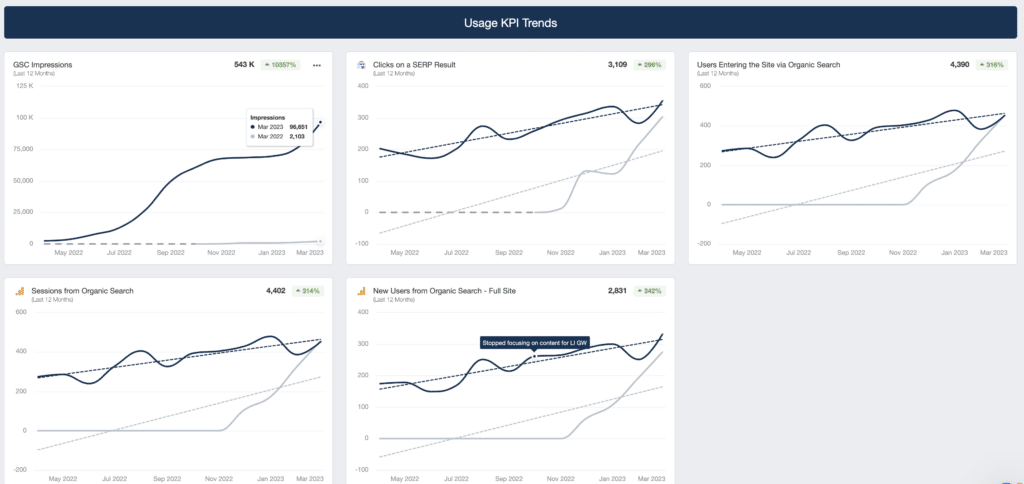
- Content Indexation: How quickly is content being indexed by Google? A site that’s regularly updated and functions without any hiccups will have its content indexed faster than its slow counterparts. Quick content indexation is a key indicator that things are moving along properly, and that Google understands what your site and content are trying to convey.
- Priority Keyword Growth: What kind of movement do we see on target keywords? Each piece of content, solution page, or backlink is targeted to an individual keyword that’s part of your greater keyword portfolio and strategy. We’ll look at how those rankings evolve over time, but during the first few months we should see tangible changes.
- Impressions: Impressions indicate how often your website appears in Google, but not necessarily how often it’s clicked through. Impressions are a great indicator of keyword growth to come.
- Clicks: We want to see how many people actually click a query to enter your site. Though we’re still in the early stages of this metric, at this stage we’ll likely begin to understand if the content we create accurately reflects what your buyers want.
Months 5-7
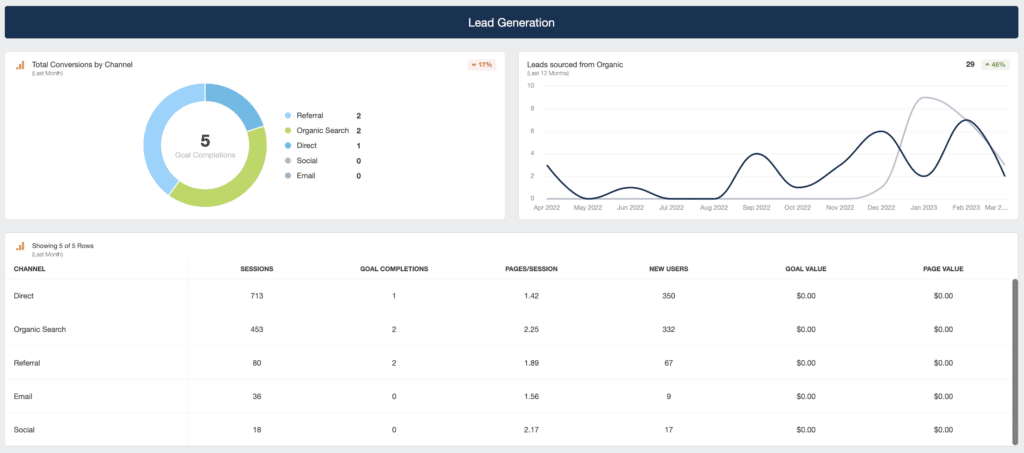
- New Users from Organic: Around this time we’ll begin to see new users enter your site from search results. While this number will fluctuate month over month, our goal is to see quarterly growth.
- Leads from Organic: We’re still at the early stages of tangible leads, but by the 7th month we can typically expect to see an increase in leads converting from our SEO strategy. This varies client by client.
Months 8-10
- MQL to SQL Rate: The MQL to SQL rate provides insights into how effectively our SEO efforts are converting leads into sales. By analyzing the rate, we can identify the areas in the content funnel where we’re losing potential customers and take steps to optimize the process. Keep in mind what we can impact only relates to SEO, not every part of your sales funnel and process.
- Lead Quality: Are we attracting the right types of buyers? It’s important for you to keep us updated on the types of conversations you have with prospects sourced from our SEO efforts so we can understand who exactly we’re bringing in.
- Keyword Market Share: Measuring keyword market share is important because it provides insights into how well you perform in search engine results pages (SERPs) compared to competitors, and helps identify opportunities for growth and optimization in SEO strategies.
Months 11-16+
- Closed Deals Sourced from Organic: Finally, we’ve made it! Around this point in time we should have a clear understanding of how the leads sourced from organic actually convert.
- Customer LTV: What is a customer worth to you? We want to ensure you have a positive ROI on our SEO efforts, and so understanding the value of a customer over its lifetime is a tangible way of doing this.
- CAC from Organic Search: What does it cost to acquire a customer via SEO? Looking at this number ensures a tight understanding of your different types of customers, the content they search, and helps us understand the best places to invest more effort.
We’ll continue to look at the metrics from the previous phases in addition to the new phase. Meaning, in months 8-10 we’ll also look at the metrics from months 1-9, but our focus will be primarily on the metrics in the most current phase.
Components of a Useful SEO Report
With your KPIs sorted, it’s now time to build your SEO report. However, not all reports are useful. Here are a few tips to help ensure yours provides the most value to your recipients:
Make It Easy to Read & Understand
One of the biggest problems with most SEO reports is that they’re usually convoluted. This is because they’re packed with too much data. To make yours easy to understand:
- Use visuals as much as possible
- Only include relevant data points
- Use language your audience understands
Focus on Actionable Takeaways, Insights, & Recommendations
Keep your SEO report as short as possible by only focusing on actionable:
- Takeaways
- Insights
- Recommendations
This way, it will be easy for your report recipients to digest the contents of the report.
Only the Key Metrics that Matter Most to Each User
Because SEO impacts every facet of a business, your SEO reports can provide invaluable insights to different departments in an organization. In such cases, create tailored reports that will only feature metrics that matter to a particular audience.
For example, a marketing manager’s dashboard should only contain relevant metrics that show marketing performance. On the other hand, if you create a dashboard for a CEO, it should contain metrics that show the organization’s overall business performance.
Wedded Bliss: Time to Marry Reports & Dashboards
To give your audience a clear picture of what’s happening, it’s advisable to include both the SEO report and dashboard. If this is not possible, make it easy to refer back to each. This is important because it helps your audience get both historical and live data. In addition, doing so makes it easy to compare periods with historical data for trend analysis.
You must also make sure that your reports are updated at regular intervals and your dashboard optimized to get real-time data.
The Top 6 SEO Reporting Tools for Every Situation
As you can see, creating an SEO report is very taxing. Manually creating one is virtually impossible with so many data points to consider and different data sources to mine.
That’s why you must invest in the best SEO reporting tools on the market.
Here are our top 6 SEO reporting tools:
- Ahrefs
- Screaming Frog
- Google Search Console
- SEMrush
- Google Data Studio
- Google Analytics
Now let’s do a deeper dive into what each has to offer.
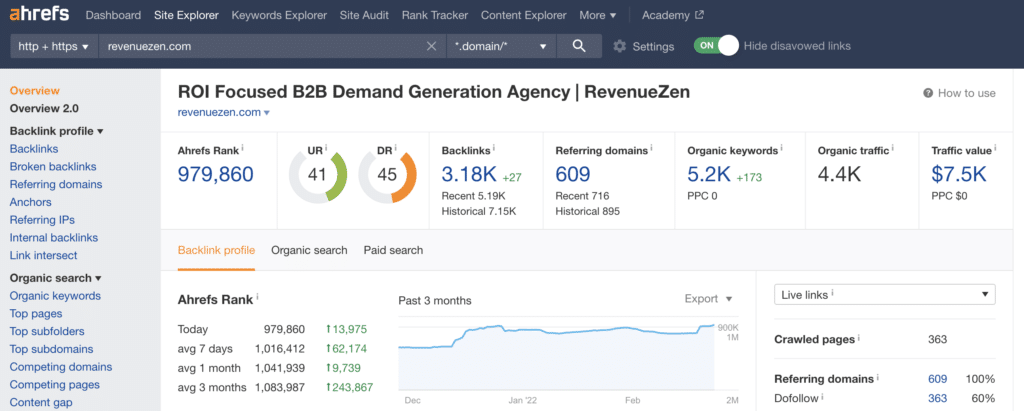
1. Ahrefs – Keyword and backlink data
The tool offers powerful insights into the most important SEO KPIs. It also comes with advanced SEO features like a site audit tool, rank tracker, backlink checker, and much more. One of Ahrefs best features is the filter option. You can create an endless amount of specific reports by applying different filters to the tool.
The only caveat with Ahrefs is the pricing as the starter plan comes in at $99/month. However, you can enjoy some of the features for free.
2. ScreamingFrog – Technical SEO data
Another powerful SEO reporting tool you must consider adding to your tool stack is Screaming Frog.
Screaming Frog is an SEO spider (or web crawler) tool that enables you to dive into the technical aspects of a website’s architecture.
Doing so helps you easily diagnose various technical and on-page issues that may affect a site’s visibility in search results. Examples of these include, among others:
- Indexing errors
- Duplicated title tags and meta descriptions
- Server response errors
- Issues with your robots.txt file
- Log analysis
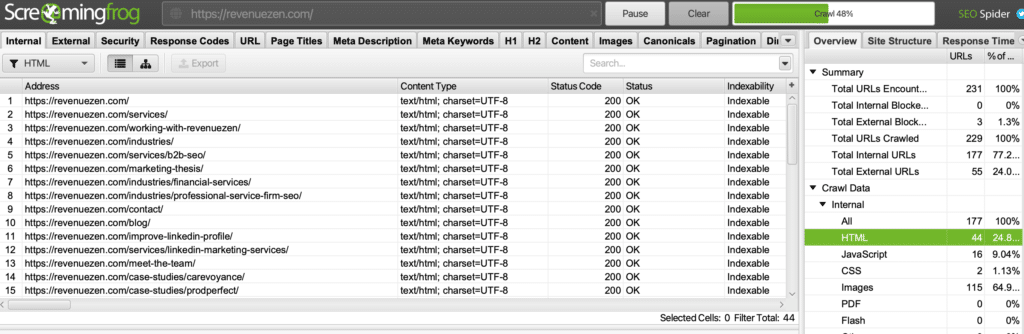
Pricing for Screaming Frog starts at $190/year.
3. Google Search Console (GSC) – Keyword and content performance data
If you’re looking for a free SEO reporting tool, your best bet would be Google Search Console (GSC).
Though it may not be as comprehensive as other tools on the list, GSC provides a lot of critical data points you can use to track your SEO performance, and it’s often more accurate than the previously mentioned. One report you’ll find invaluable is the Page Experience report. This explores user experience (UX) metrics like:
- Mobile-friendliness
- Core web vitals
- Security
Other reports you can get in GCS include:
- Search Performance Report: reports on keywords, rankings, impressions, click-through rates, organic traffic, e.t.c.
- Crawl Status Report: Shows which pages search engines can’t crawl and index. It also shows you the successful fixes you made.
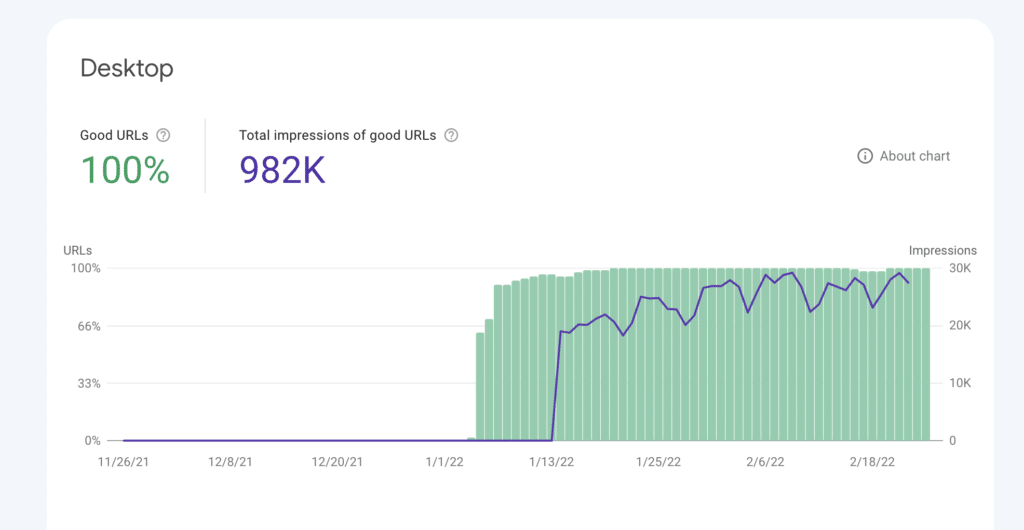
GSC is a great starting point for collecting key metrics for your SEO campaigns.
4. SEMrush – Competitor, keyword, and content performance data
Another powerful SEO reporting tool to consider is SEMrush.
Like Ahrefs, Semrush is an all-in-one tool you can use to track data points across various platforms. You can use it to track, among others:
- Keyword rankings (branded and unbranded)
- Organic sessions
- Organic visibility
- Backlinks
You can also use the tool for competitor analysis to get a picture of your position in the market. You can also order custom reports through the platform for an extra charge.
While you can get started with SEMrush for free, unlocking its full potential will require you to part with $119.90/month for the base plan.
5. Google Data Studio – Use your data to create an SEO dashboard
Want to turn your data into easy-to-digest visuals?
Then Google Data Studio is the tool you need.
Google Data Studio is a powerful data visualization tool that pulls data from many sources and helps you turn it into informative reports and dashboards. One of the best parts of Google Data Studio is that it comes with some pre-built customizable templates you can use to create beautiful data presentations.
6. Google Analytics – Content performance and conversion event data
Another free tool that must be a staple in every SEO’s toolbox is Google Analytics (GA).
GA is a powerful tool that shows you exactly what is happening on your website. It can help track data points such as:
- Traffic sources
- Visitor behavior
- User event based conversions
However, the best feature in GA is the Conversion Goals. This allows you to input some campaign goals and track completion rates.
If managing all these tools, reports and dashboards seems overwhelming, consider outsourcing this function to a reputable SEO agency.
SEO report FAQs
“How do I make an SEO report in excel/google sheets?”
Great question, this is a great guide and google sheets template to get you started. Download as an excel file if you want to go that route.
“How do I read and understand an SEO report?”
The best way to understand an SEO report or dashboard is to have the person or agency who created it walk you through it step by step. You can record a video of this session or ask them to make you a step by step overview of the report as well. If you’re reviewing a report that you made yourself from a template, look back at the documentation from the provider or platform who created it. If there’s no documentation, reach out to support and ask them for help. You can also get in touch with RevenueZen and we’re happy to walk you through it.
“What is an SEO analysis report?”
Analysis reporting is a document that outlines your key findings from any kind of SEO related research. This could be keyword research, competitor analysis, a content audit, etc. This is different from standard reporting because you’re not just presenting data, you’re interpreting it’s meaning and providing strategic guidance based on your expertise.
Use Your SEO Report to Power Your SEO Wins
SEO reporting is a critical component of running a successful B2B marketing strategy. Without it, you’ll be flying in the dark.
With regular reporting, you can anticipate SEO trends and uncover hidden opportunities. Both are essential to planning and executing an effective SEO strategy.
However, if all this sounds overwhelming (as we know it can be), feel free to reach out. We have years of SEO and web analytics reporting under our belt, and we believe we can help you with your entire SEO campaign lifecycle.
So, go ahead and get in touch and let’s dive into your SEO performance.